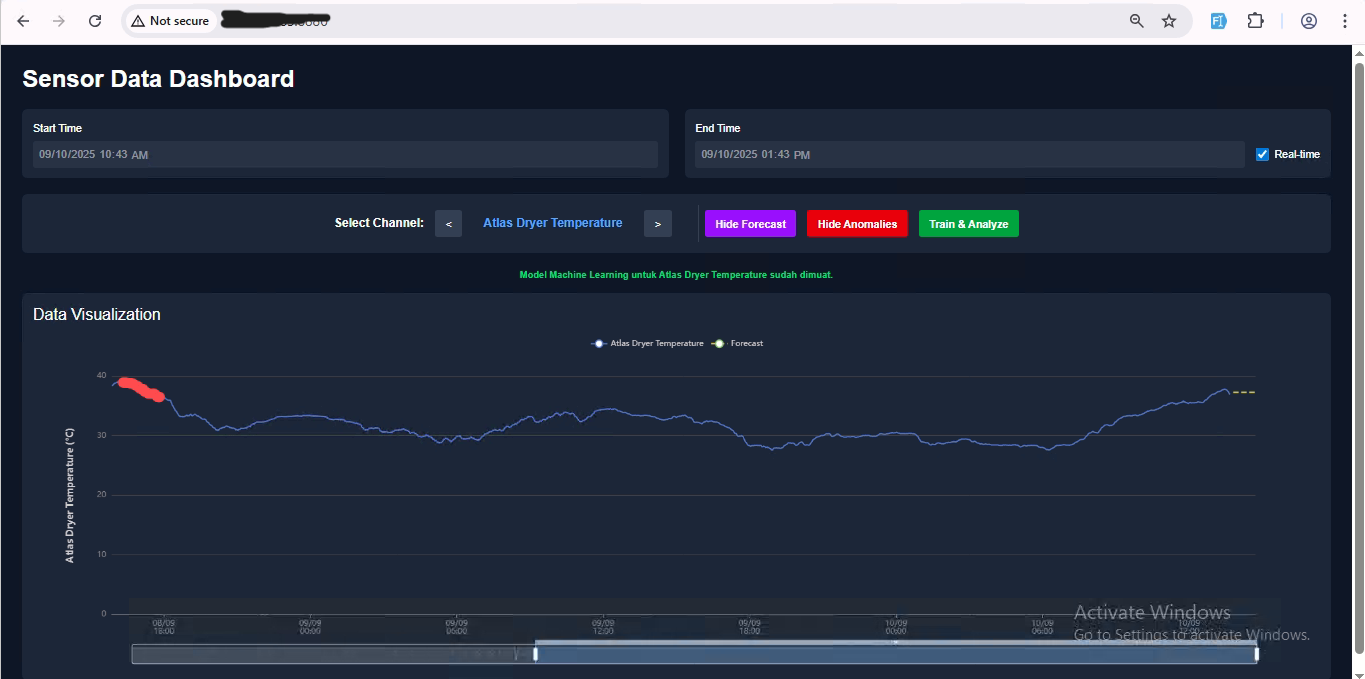
Project Overview
This project is a sophisticated web-based system designed to monitor real-time sensor data from Atlas Copco compressors. The application integrates two core machine learning functionalities: predictive forecasting to predict future sensor values and anomaly detection to identify unusual operational patterns. The system features an interactive dashboard for data visualization and a dedicated service for on-demand model training and analysis, providing a complete solution for proactive industrial maintenance.
Machine Learning Strategy
The system employs a suite of custom-trained machine learning models, with tailored strategies for different types of sensor data to maximize accuracy and relevance.
- Time-Series Forecasting: A LightGBM Regressor is used for its speed and accuracy. The model's strategy adapts to the data's nature:
- For standard data (e.g., temperature, pressure), it predicts values directly using lag features and rolling statistics.
- For cumulative data (e.g., consumption), it predicts the rate of change (`.diff()`) and reconstructs the total value using a cumulative sum (`np.cumsum`).
- For imbalanced data (e.g., on/off flow), a sophisticated two-model approach is used: a Random Forest Classifier (trained on SMOTE-balanced data) predicts the "on/off" state, while a LightGBM Regressor predicts the value *only* when the state is "on."
- Anomaly Detection: Two distinct models are used based on data characteristics:
- A PyTorch LSTM Autoencoder is used for univariate time-series data. It learns to reconstruct normal signal patterns; a high reconstruction error on new data indicates an anomaly.
- An Isolation Forest model is used for multivariate data, where it effectively isolates anomalous data points by leveraging multiple features simultaneously.
System Architecture & Technology
The application is architected with three decoupled components to handle different responsibilities efficiently, ensuring the user interface remains responsive even during intensive ML model training.
- Frontend: An interactive dashboard built with Next.js and ReactECharts for dynamic data visualization. It communicates with the backend services via both HTTP (for historical data) and WebSockets (for real-time data and training logs).
- Backend Service: A FastAPI (Python) application responsible for serving historical and real-time sensor data, and performing real-time anomaly detection using pre-trained models.
- Prediction Service: A dedicated FastAPI (Python) service that handles all heavy machine learning tasks. It exposes WebSocket endpoints to trigger on-demand model training as a separate subprocess, stream training logs back to the user, and serve forecast results.